new
Reporting
Visualization
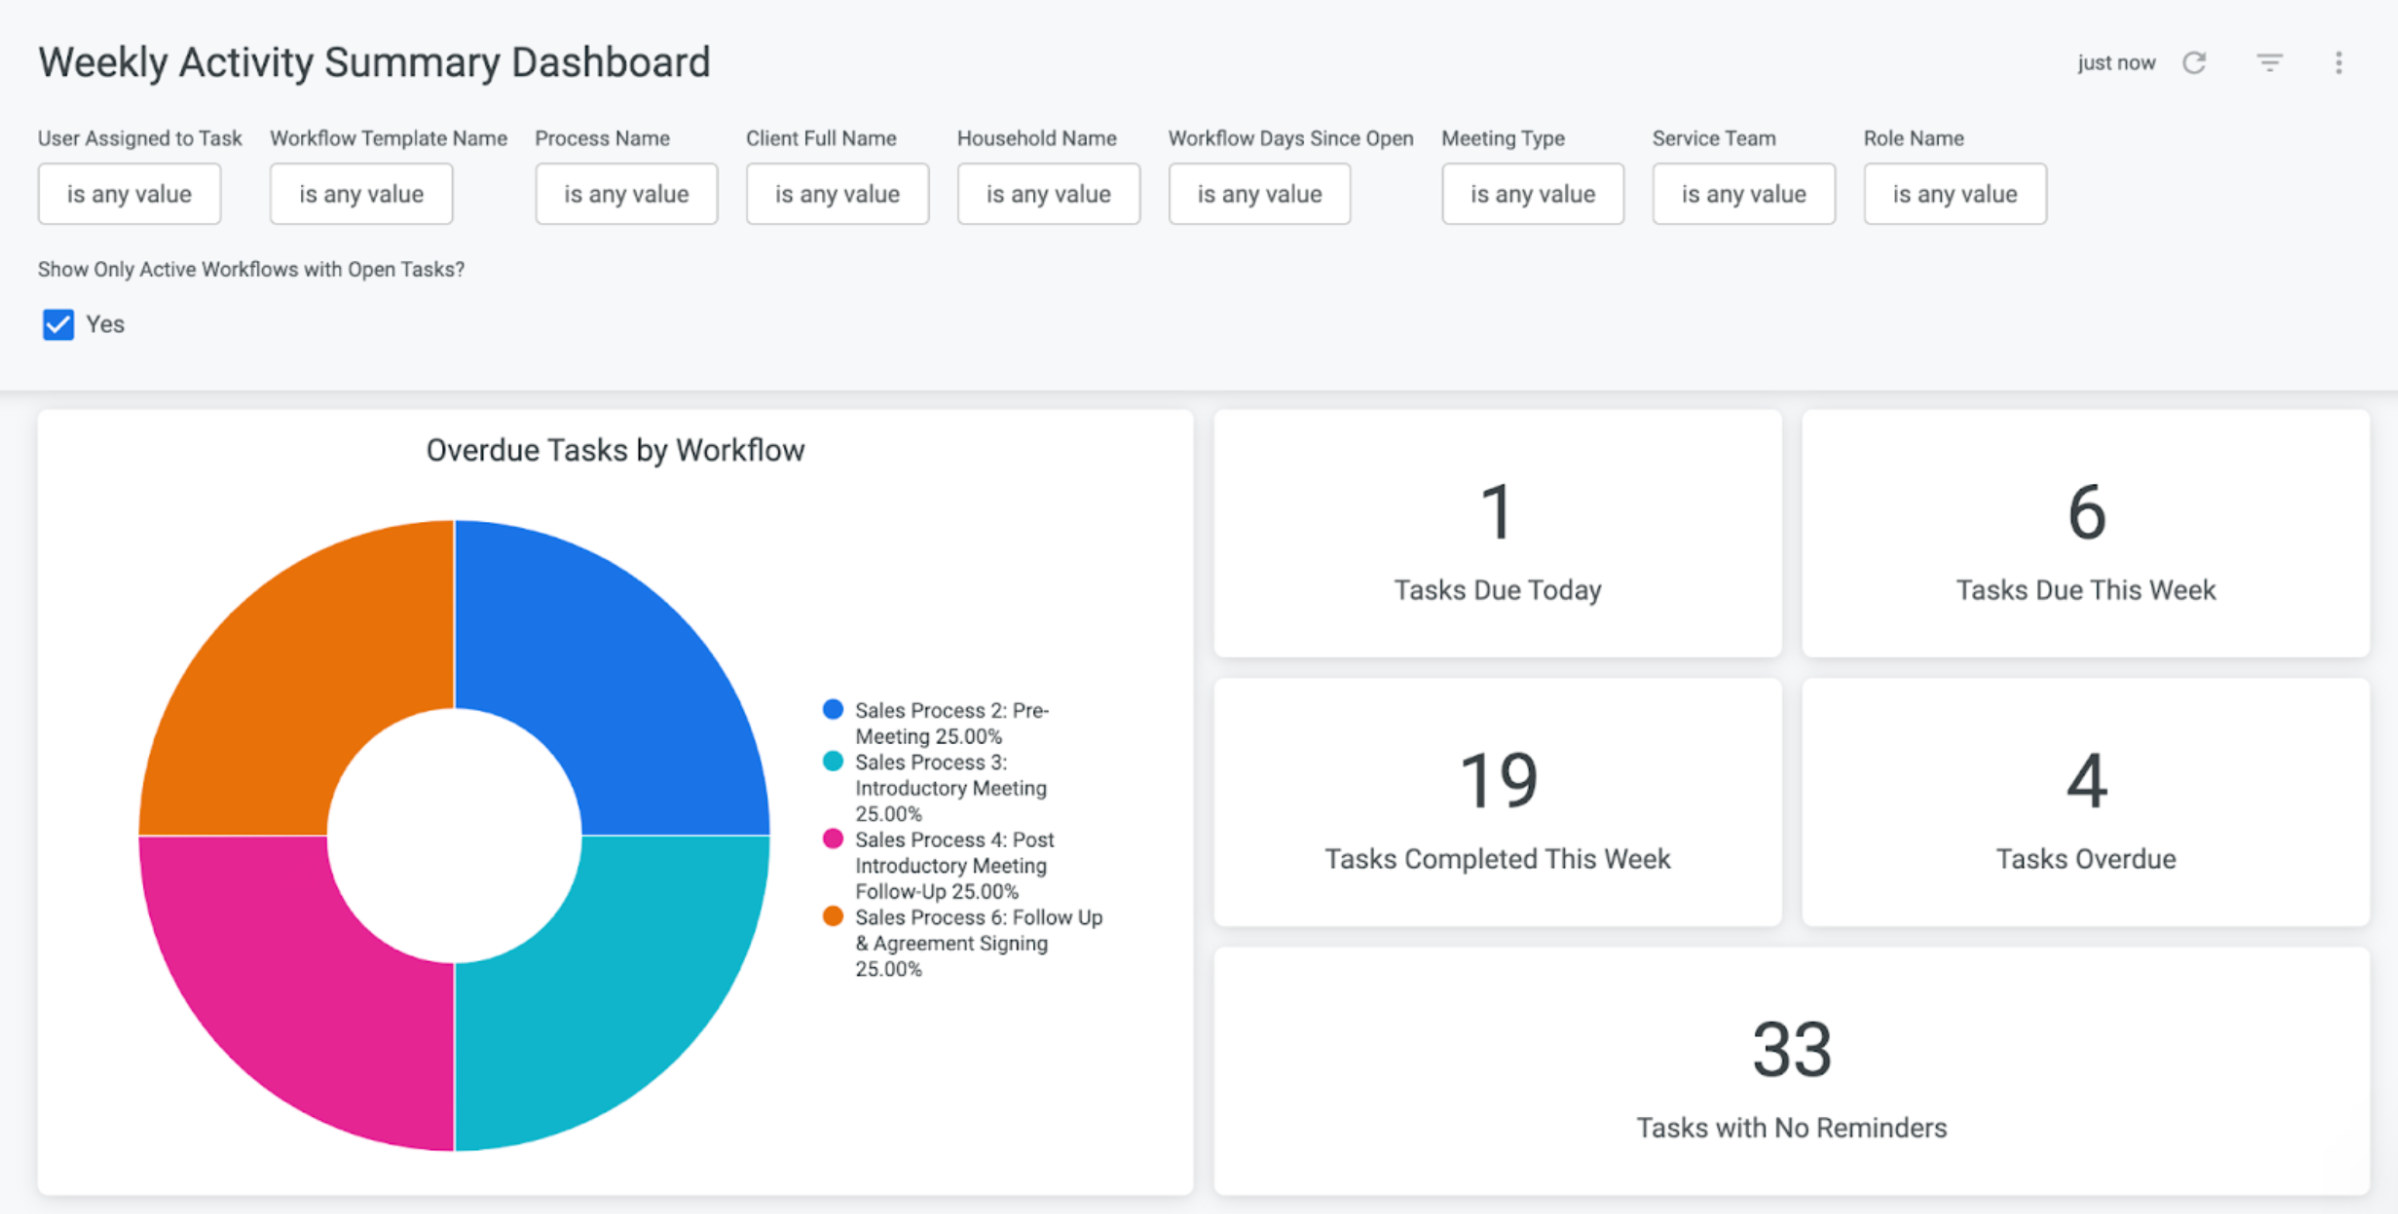
Introducing Insight Dashboards!

Hubly’s new Insight Dashboards feature
utilizes the data from work carried out across firms with two or more team members
to:- Turn activity in Hubly into easy-to-use business intelligence dashboards
- Provide clarity, alignment, and actionable insights from your firm to prevent work from slipping through the cracks
- Identify bottlenecksbefore they reach your clients,fix inefficient processes, and improve your client servicing and forecasting
- See who is being over- or under-utilized in your firm to improve productivity, manage workloads, and make informed hiring decisions
Insight Dashboards are
valuable for firms with multiple team members
. Visually analyze the data generated across the team in a single space. Effortlessly track client growth, team capacity, and see where processes might be breaking down or taking too long.To enable Insight Dashboards,
you must be an Admin in your Hub
. Click your name in the top right corner of your Hub, then click “Settings”. From there, click the ellipses (three dots) next to a user’s name in the Users table, and then click “Enable Insights”. This will turn on Insight Dashboards for this user.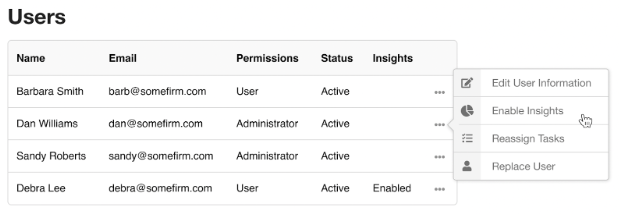
*Please note: A limited amount of users per firm can receive access to Insight Dashboards.
Once enabled, click “Insights” in the top right corner of your main Hub screen. From there, select one of the many Dashboards Hubly has launched to view actionable data generated by your firm.

Try it out for yourself and don't forget to Like and Leave Your Feedback letting us know how we can continue to improve your experience in Hubly!